
Categories
Market Updates, Home Buyers, Home SellersPublished November 1, 2026
How is North Atlanta Real Estate Market (3rd Quarter 2026)

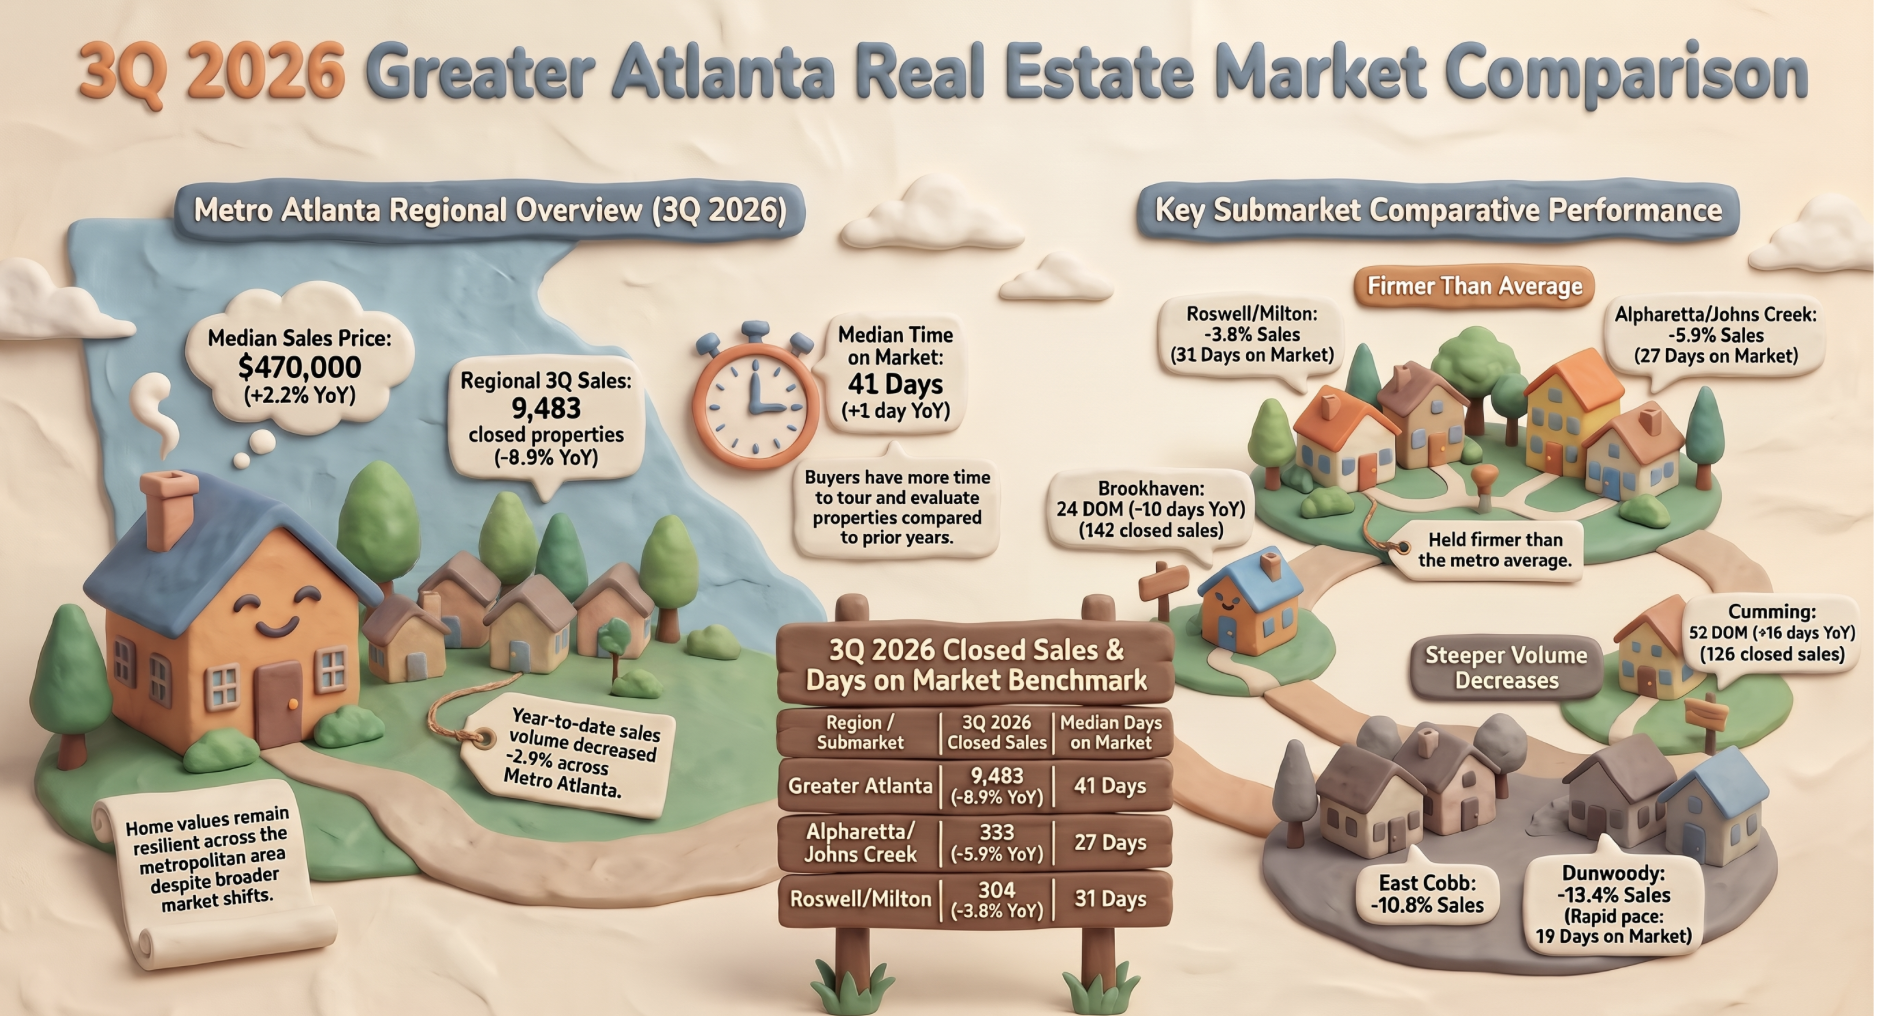
Q3 2026 North Atlanta Market Update: A More Balanced Market, Area by Area
The Atlanta market is not crashing, and it is not the frenzy of a few years ago either. It is settling into something more balanced, and that changes how both sides should plan. Buyers have more choices and more room to negotiate. Sellers are still holding meaningful equity, but they are no longer competing in a market that forgives pricing mistakes. Homes that are priced well and presented well from the first day still draw strong attention. Homes that start high tend to spend more time on the market, and often end up adjusting anyway. Concessions and rate strategies have become a normal part of the conversation, and local conditions vary from one corridor to the next. The takeaway is simple: this is a market that rewards preparation, accurate pricing, and honest guidance. Below is what I am seeing in our area.
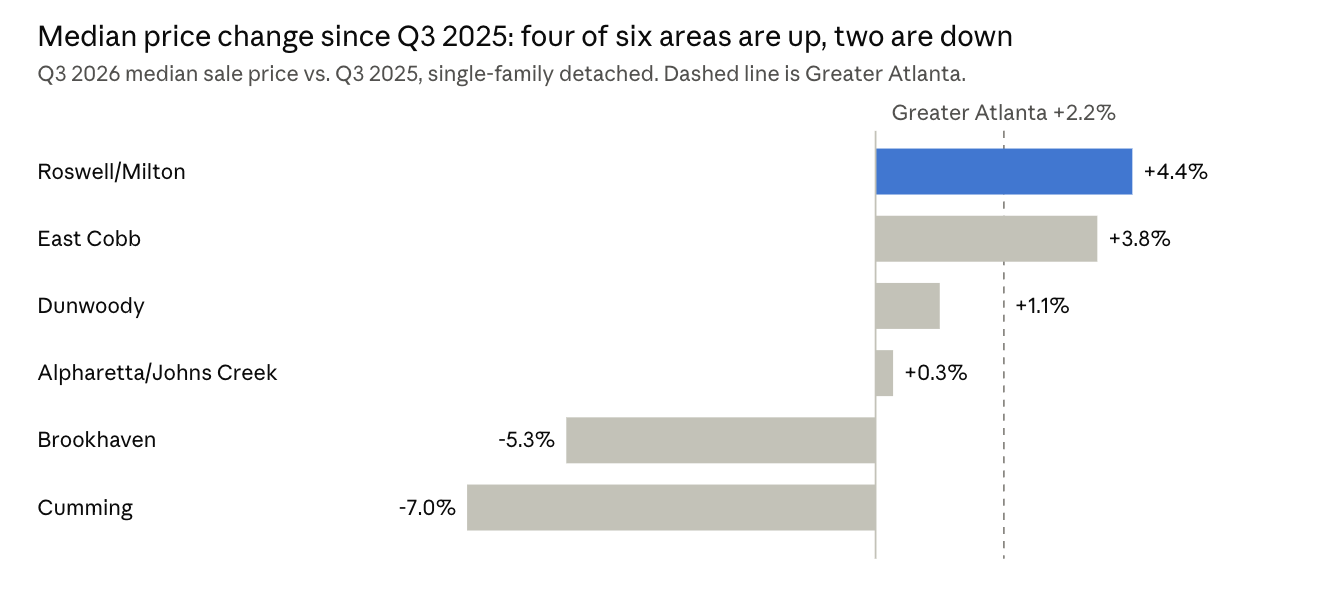
Prices: four areas up, two down
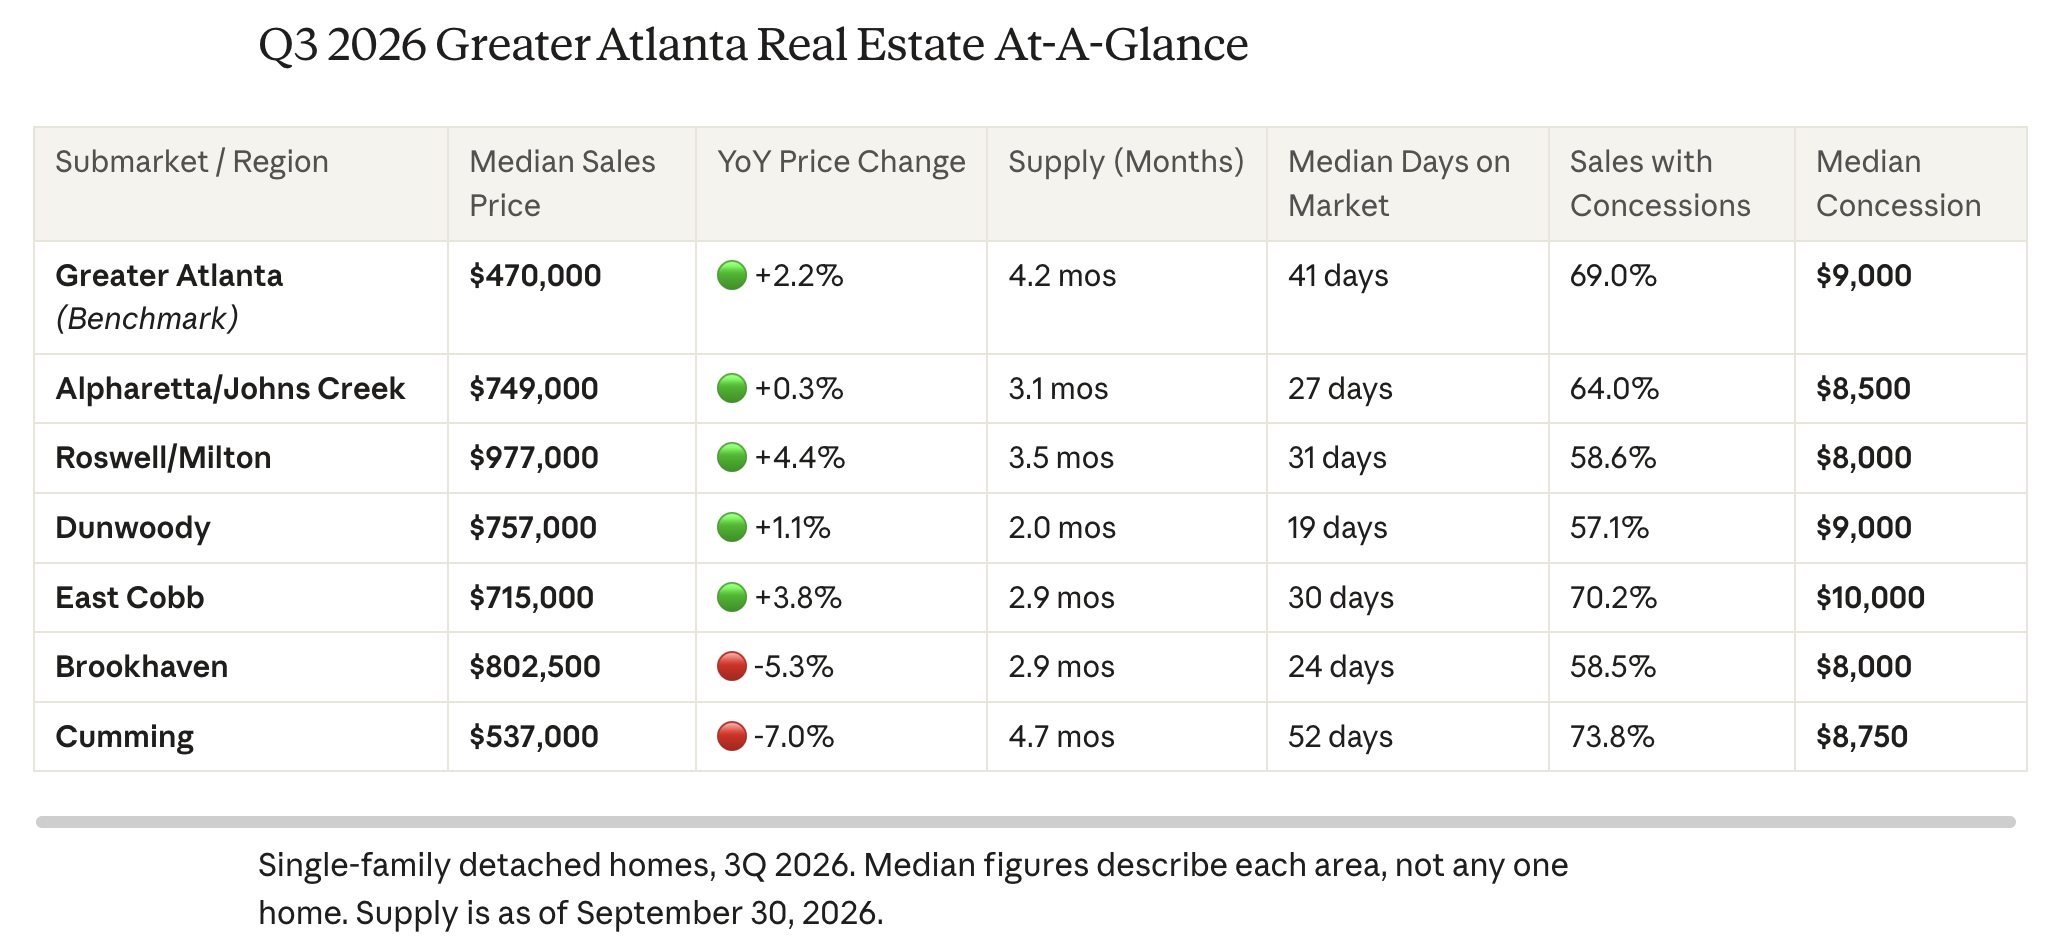
Compared with Q3 2025, median sale prices are higher in four of the six areas and lower in Brookhaven and Cumming, while Greater Atlanta overall rose 2.2%.
A median is a snapshot of what sold in the quarter, not a measure of what any one home is worth. A quarter with more higher priced sales can move it on its own, so I read price alongside how long homes took to sell.
Year to date is more cautious than the quarter
Q3 compared with Q3 a year earlier is one snapshot. Across January through September, only Roswell/Milton is above last year's median price. The other five areas are lower than the same nine months of 2025, even where Q3 on its own was higher.
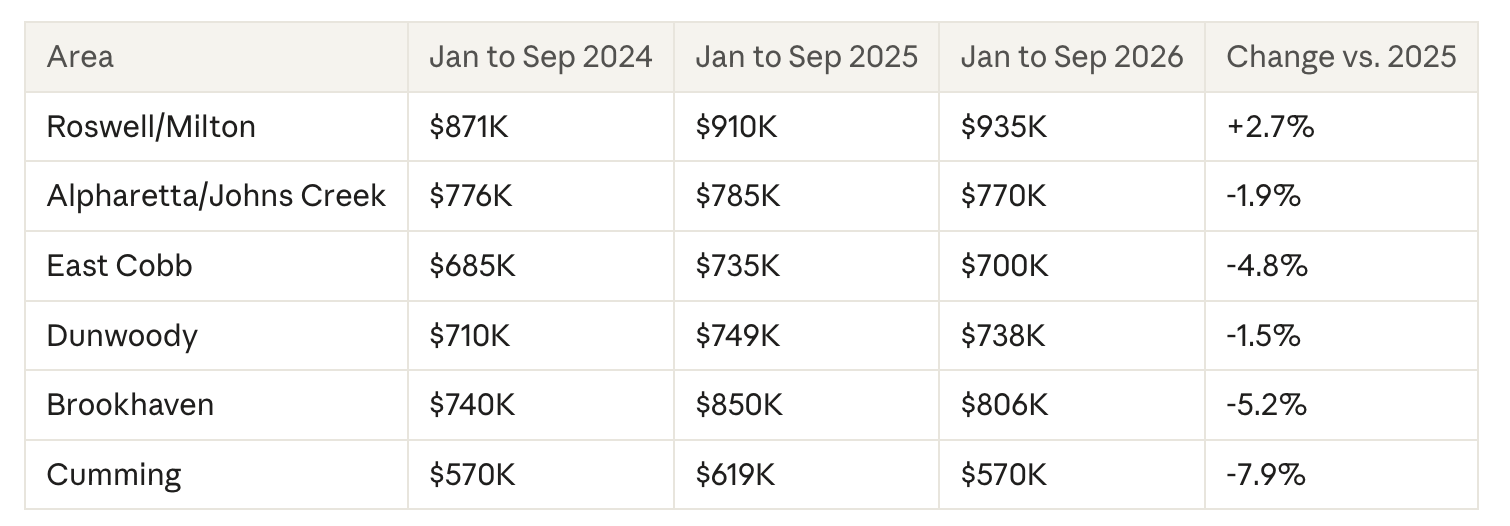
Year to date medians cover all single-family detached sales from January through September. The change column is calculated from the rounded medians.
That gap between a stronger Q3 and a softer year is why I look at several measures together. A single quarter can sit inside a year where prices were lower overall.
Time: homes are taking longer to sell
Median days on market is higher than it was two years ago in all six areas. Cumming moved the most, and Dunwoody is still the quickest.
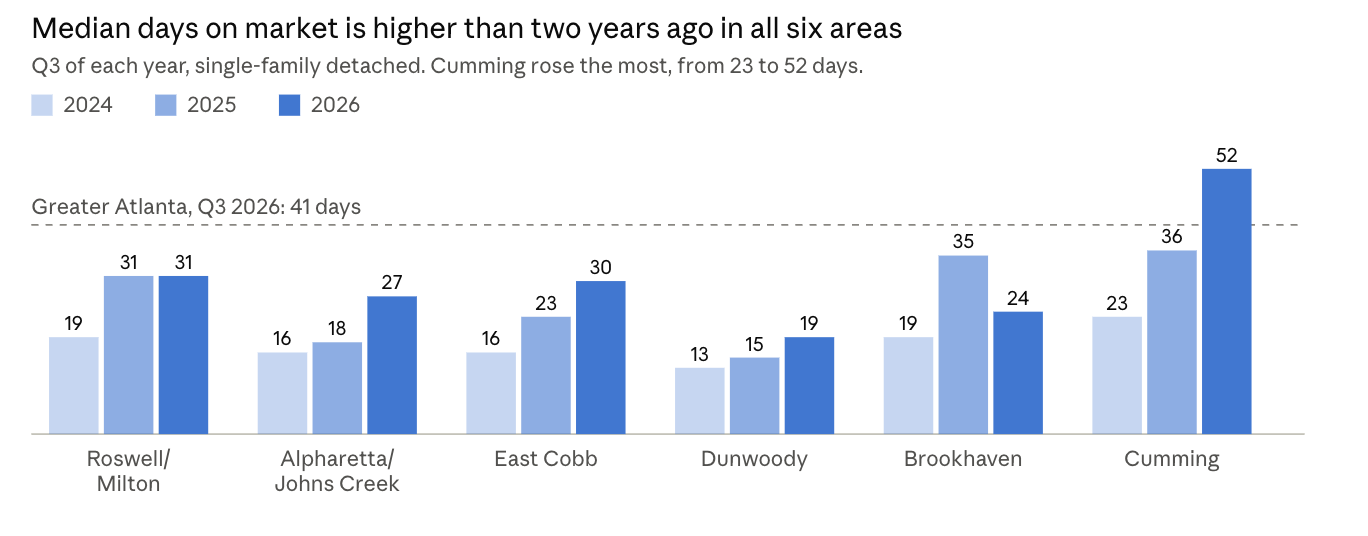
By the report's own scale, under six months of supply favors sellers, and every area here is still under that line, from 2.0 months in Dunwoody to 4.7 in Cumming. What changed is the pace and the amount of negotiation, not a shortage of buyers or homes.
Roswell/Milton up close
Roswell/Milton's median price has climbed to $977,000, but the quarter by quarter record shows a market that is easier to negotiate than it was two years ago.
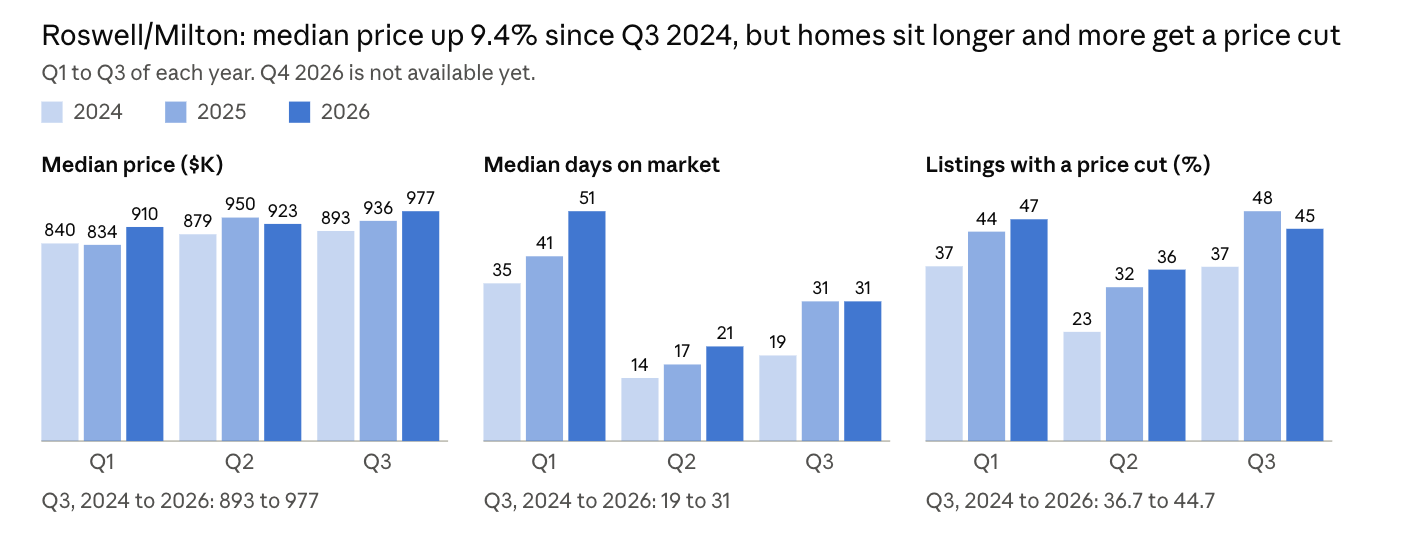
A few more details from the Q3 report:
- Homes selling at or above list price: 37.8% in Q3 2024, 28.9% in Q3 2026.
- Sale price as a share of original list price: 97.8%, now 96.0%.
- Sales with seller concessions: 49.7%, now 58.6%, with a $8,000 median.
- Closed sales from January through September: 832 in 2024, 884 in 2025, 909 in 2026.
The slowdown is not a one quarter story. Every quarter shown above is slower than the same quarter a year earlier. In both 2024 and 2025 the fourth quarter was slower than the third, so that is the number I will watch next.
The other areas, two years in (Q3 2024 to Q3 2026)
- Alpharetta/Johns Creek: median price $780K to $749K, days on market 16 to 27. The share of listings with a price cut rose from 32.7% to 44.7%, and homes selling at or above list price fell from 45.5% to 29.4%.
- East Cobb: median price $681K to $715K, days on market 16 to 30. Sales with seller concessions went from 53.8% to 70.2%, and failed listings from 24.8% to 41.5%.
- Dunwoody: median price $708K to $757K, days on market 13 to 19. Closed sales from January through September rose from 219 to 276, and it has the lowest supply of the six at 2.0 months.
- Brookhaven: median price $795K to about $803K, days on market 19 to 24. It has been uneven: the slowest point was Q3 2025 at 35 days, with some improvement since.
- Cumming: median price $576K to $537K, days on market 23 to 52. Listings with a price cut went from 36.4% to 63.5%, and 73.8% of Q3 sales included seller concessions.
How we got here: the quarterly record
Quarter by quarter, the market has a clear seasonal rhythm, and the last two years have moved the whole line upward.
Three patterns stand out:
- Spring is the fastest season. In 2024 and 2025, the second quarter had the lowest or tied for lowest median days on market in every area, and it does so again in 2026 so far.
- The slow seasons got slower. Days on market in Q4 2025 was higher than in Q3 2025 in all six areas, and Q1 2026 was the slowest first quarter of the three years in five of the six (Dunwoody is the exception).
- The fast season is slowing too. Roswell/Milton's second quarter went from 14 days in 2024 to 17 in 2025 to 21 in 2026.
Negotiation has grown with it
Beyond time, the other measures in the area reports moved in the same direction between Q3 2024 and Q3 2026.
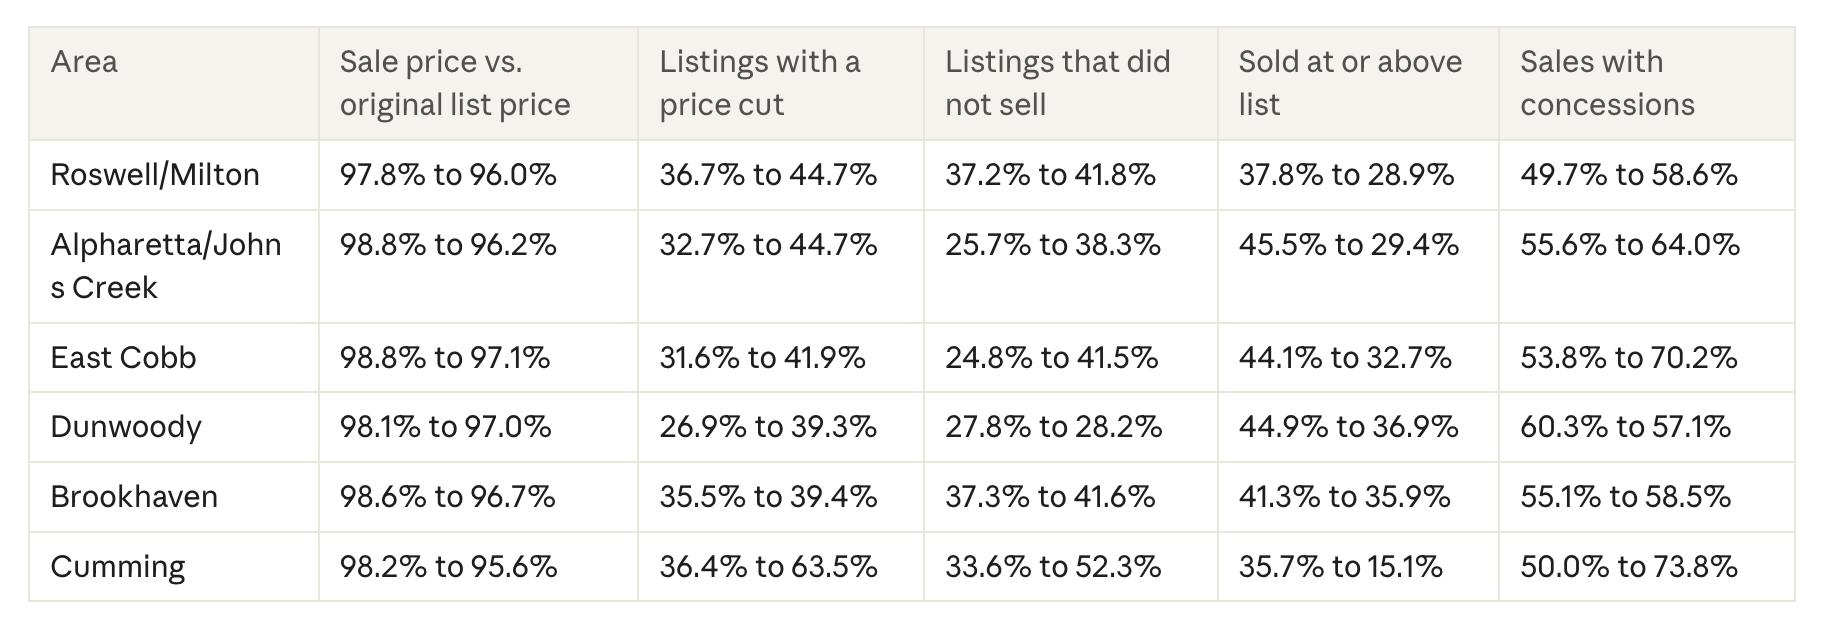
A few things the table shows:
- Cumming is the outlier. More than half of Q3 listings (52.3%) did not sell, and only 15.1% of sales closed at or above list price.
- Dunwoody is the steadiest. The share of listings that did not sell is flat, and its share of sales with concessions is lower than two years ago.
- Brookhaven had its weakest reading in Q3 2025 (35 days on market, 28.8% sold at or above list) and has recovered part of that.
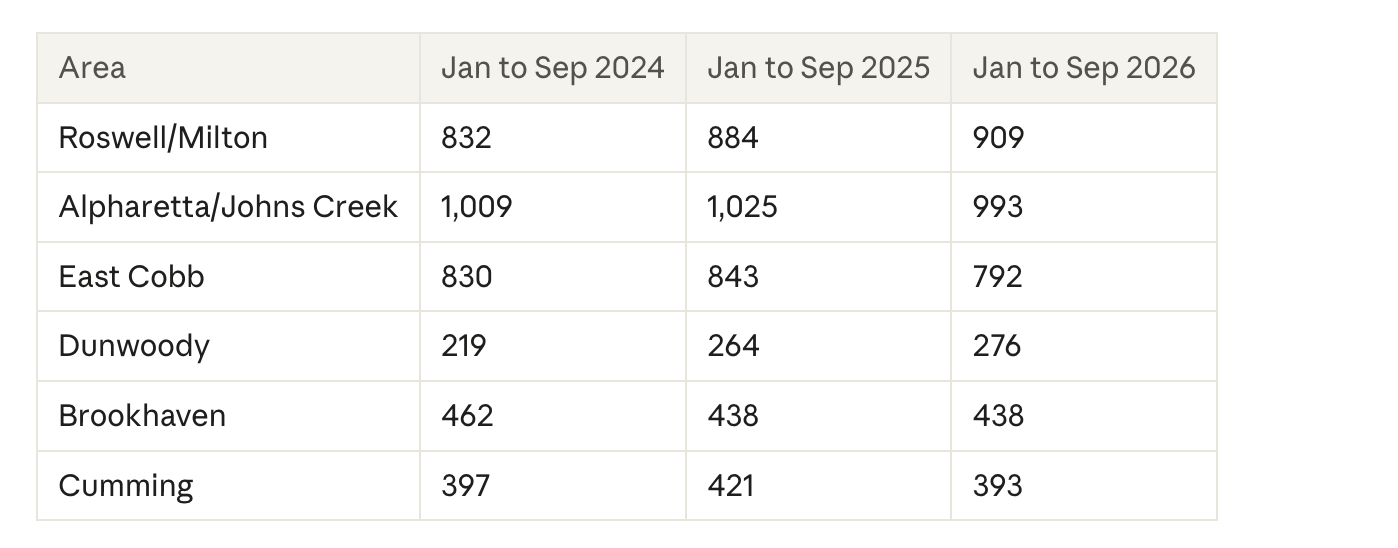
Closed sales
Volume is steadier than price. Roswell/Milton and Dunwoody have more closings than in 2024 and 2025. East Cobb, Alpharetta/Johns Creek and Cumming have fewer than in 2025, and Brookhaven is unchanged from 2025.
What this means
If you are selling: pricing accuracy matters more than it did. In Roswell/Milton, 44.7% of Q3 listings took a price cut, and the average cut was 7.0%. Concessions are part of the conversation too: 58.6% of Roswell/Milton sales included one.
If you are buying: you have more choices and more room to negotiate. Median days on market is up in every area, and seller concessions appeared in between 57% and 74% of sales across the six areas.
In both cases, the area average is a starting point. Your street, your price range and your home's condition decide the rest.
Looking ahead
There are three ways the next few quarters could play out, and each leaves different marks in the data:
- Gradual softening continues. Days on market keeps rising against the same quarter a year earlier, price cuts keep climbing, and concessions stay at or above Q3 levels. This is the direction in every area since 2024.
- Stabilization. Days on market holds near last year's levels and price cuts level off. Roswell/Milton's Q3 days on market was 31 in both 2025 and 2026, and Brookhaven improved from 35 to 24, so there are early signs of this in a few places.
- Re-tightening. Days on market shortens, more homes sell at or above list price, and concessions fall. Dunwoody is the closest to this today, at 2.0 months of supply and 19 days on market.
None of these is a forecast. They are the outcomes I will check against each quarter.
Want the street-level version for your address?
Message me and I will pull the numbers that apply to your home or your search.
Rana Tayara, REALTOR® | Real Estate Consultant | Keller Williams Realty Consultants
678-294-3838 | RanaTayara@kw.com | www.RanaTayara.com
Get a Hyper-Local Market Analysis
Are you curious about the pricing efficiency of your specific neighborhood subdivision? For a hyper-local pricing evaluation, connect with Rana Tayara, your trusted North Atlanta real estate expert.
| LET'S TALK ABOUT YOUR HOME Want to know what these numbers mean for your address? Metro trends are a starting point, not an answer. If you are thinking about buying or selling in Alpharetta, Roswell, Dunwoody, East Cobb, Cumming, or anywhere across North Atlanta, I will put together a clear, honest read on your specific situation. No pressure, just real numbers and a plan. |
Phoenix Award- Atlanta Board of Realtors
Keller Williams Realty Consultants
Serving the North Atlanta Area
📱 Call/Text: 678.294.3838
✉️ Email: ranatayara@kw.com
🌐 Website: www.RanaTayara.com
Other Articles:
Homestead Exemption- Your second opportunity
Your 2026 Property Assessment is Out. What you need to know before the Deadline
How's the Real Estate Market in North Atlanta- June
Why 65% of North Atlanta Homeowners are Leaving Money on the Table
Why Atlanta is the Nb 1 City to Start a Career
Upsizing in North Atlanta
2025 Luxury Housing Market
Your 2026 Property Assessment is Out. What you need to know before the Deadline
How's the Real Estate Market in North Atlanta- June
Why 65% of North Atlanta Homeowners are Leaving Money on the Table
Why Atlanta is the Nb 1 City to Start a Career
Upsizing in North Atlanta
2025 Luxury Housing Market

Rana Tayara
| Rana Tayara Homes | Keller Williams Realty Consultants
or another way