
Categories
Market Updates, Home Buyers, Home Sellers, Tips for HomeownersPublished August 24, 2026
How Is the North Atlanta Housing Market? (July 2026)


The Greater Atlanta real estate market is undergoing a profound structural pivot. While high-level headlines focus on resilient prices, the real story is a massive, data-driven divide that is punishing over-ambitious sellers and rewarding buyers who know where to look.
According to July 2026 single family housing data, North Atlanta is experiencing a silent inventory shift that is rewriting the rules of real estate negotiation. Below, we break down the critical trends across Alpharetta, Roswell, Dunwoody, East Cobb, and Cumming, and analyze what this means for your financial goals.
Yes, North Atlanta remains a seller's market in July 2026, but seller leverage is shifting due to a significant surge in active listings. Metro Atlanta holds 3.8 months of supply, but over 69% of listings are overpriced. Correctly priced homes sell in a median of 12 days for 100.0% of list price, while overpriced listings linger for 91 days and sell for 8.1% less than originally listed.
The Inventory Illusion: The "Pooling Effect" Exposed
Many homeowners look at rising inventory numbers and assume that a flood of new sellers must be putting "For Sale" signs in yards. This is an inventory illusion.
The July 2026 FMLS data reveals a far more interesting market mechanism: the "Pooling Effect."
Metro-wide, seller activity is actually cooling down. New Listings are DOWN 4.0% year-over-year (5,756 in July 2026 vs. 5,997 in July 2025) and dropped 7.0% month-over-month from June's 6,192. So why is active inventory building up?
Total Active Listings are sitting at 13,359, only down 1.3% YoY from July 2025 (13,529), but up 2.3% month-over-month from June (13,060). The explanation lies in a dramatic transaction bottleneck: Pending Sales are down 8.6% YoY (4,082) and Closed Sales are down 6.2% YoY (3,497). Month-over-month, the slowdown is even starker, closed sales fell 15.7% and pending sales fell 13.1% compared to June.
Because overpriced properties are experiencing massive resistance from buyers, homes are staying on the market longer. Homes are entering the market at a slightly slower rate, but they are leaving the market at an even slower rate. This causes listings to "pool" and accumulate, resulting in a sudden 22.6% month-over-month expansion in months of supply, jumping from 3.1 months in June to 3.8 months in July.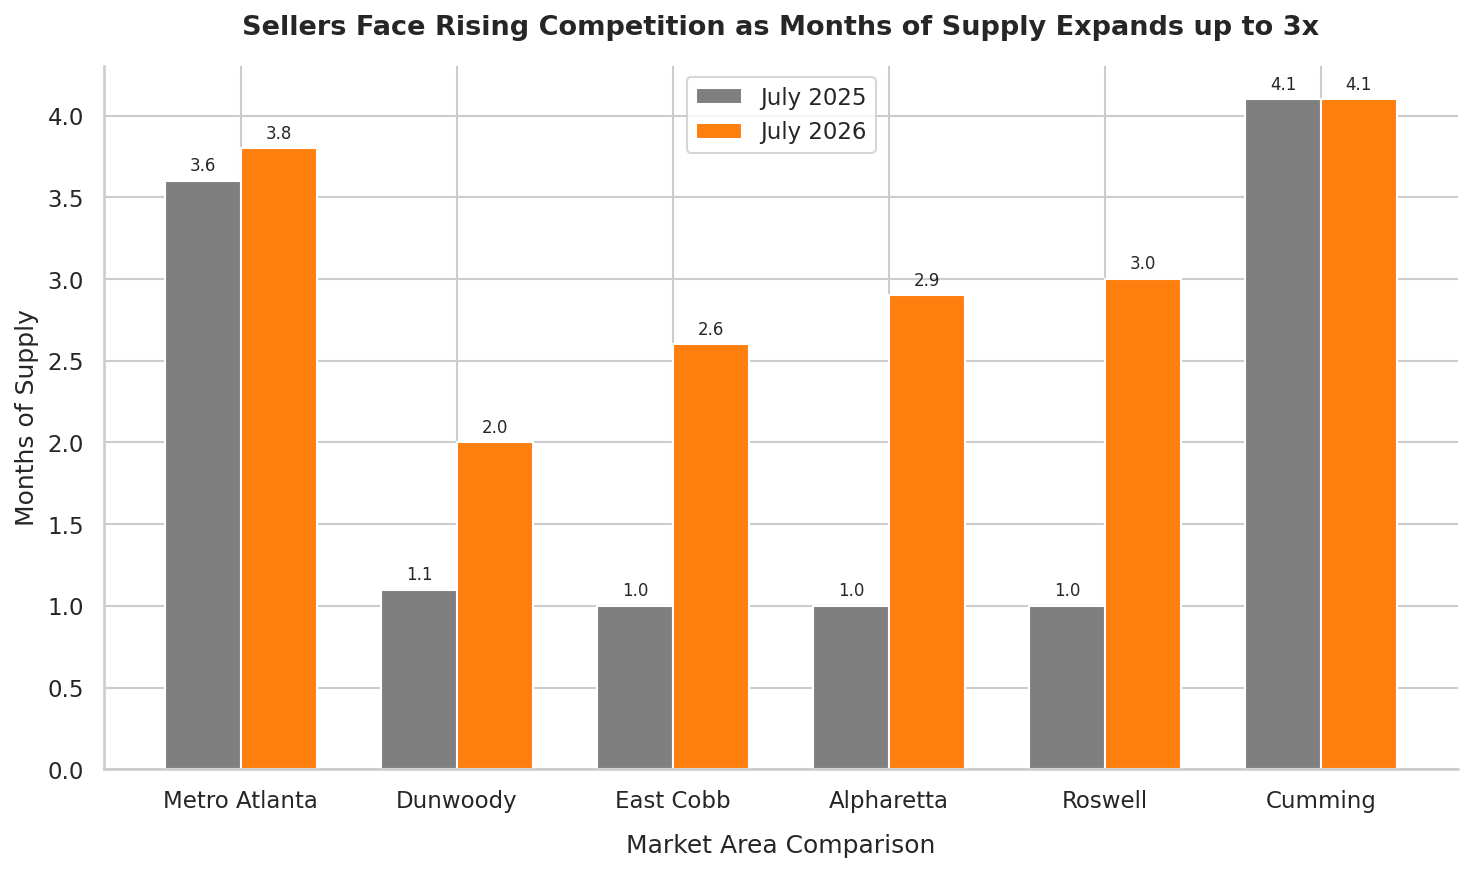 This chart tracks months of supply expansions across North Atlanta, demonstrating how local markets are accumulating inventory and moving closer to a balanced state compared to July 2025.
This pooling pattern is playing out across North Atlanta’s most popular suburbs in an even more extreme way:
- Roswell (Area 23): Roswell is the ultimate case study of the pooling effect. New listings rose only 2.3% YoY (from 173 to 177), yet active inventory exploded by 208.3% YoY (from 120 to 370 active homes). Because properties aren't leaving the market as quickly, Months of Supply has surged by 200.0% YoY (climbing from a lean 1.0 month to 3.0 months of supply).
- Alpharetta (Area 24): Alpharetta sellers put only 11.4% more new listings on the market YoY (186 vs. 167). Yet, active inventory has built up to 367 active listings, representing a 169.9% surge compared to last year's 136, as Months of Supply expanded by 190.0% YoY from 1.0 to 2.9 months of supply.
- East Cobb (Area 15): East Cobb saw a modest 9.3% increase in new listings YoY (153 vs. 140). However, total active inventory skyrocketed by 130.9% YoY (254 active homes vs. 110 last year), driving supply up 160.0% YoY to 2.6 months of supply.
- Dunwoody (Area 16): Dunwoody's active inventory surged 58.3% YoY (from 36 to 57 active homes) as Closed Sales dropped 12.5%, and Pending Sales dropped 13.9%.
- Cumming & Forsyth County: Cumming represents the most striking dynamic of all. New listings actually fell by 5.8% YoY(dropping from 479 to 451). Yet, active listings still grew 5.2% YoY (to 1,224) because the pace of sales slowed, proving that inventory can build even when seller activity declines.
For homeowners, this means your competition isn't just "new" listings hitting the market, it is the accumulating backlog of homes that listed weeks ago at over-ambitious prices and are now pooling on the market.
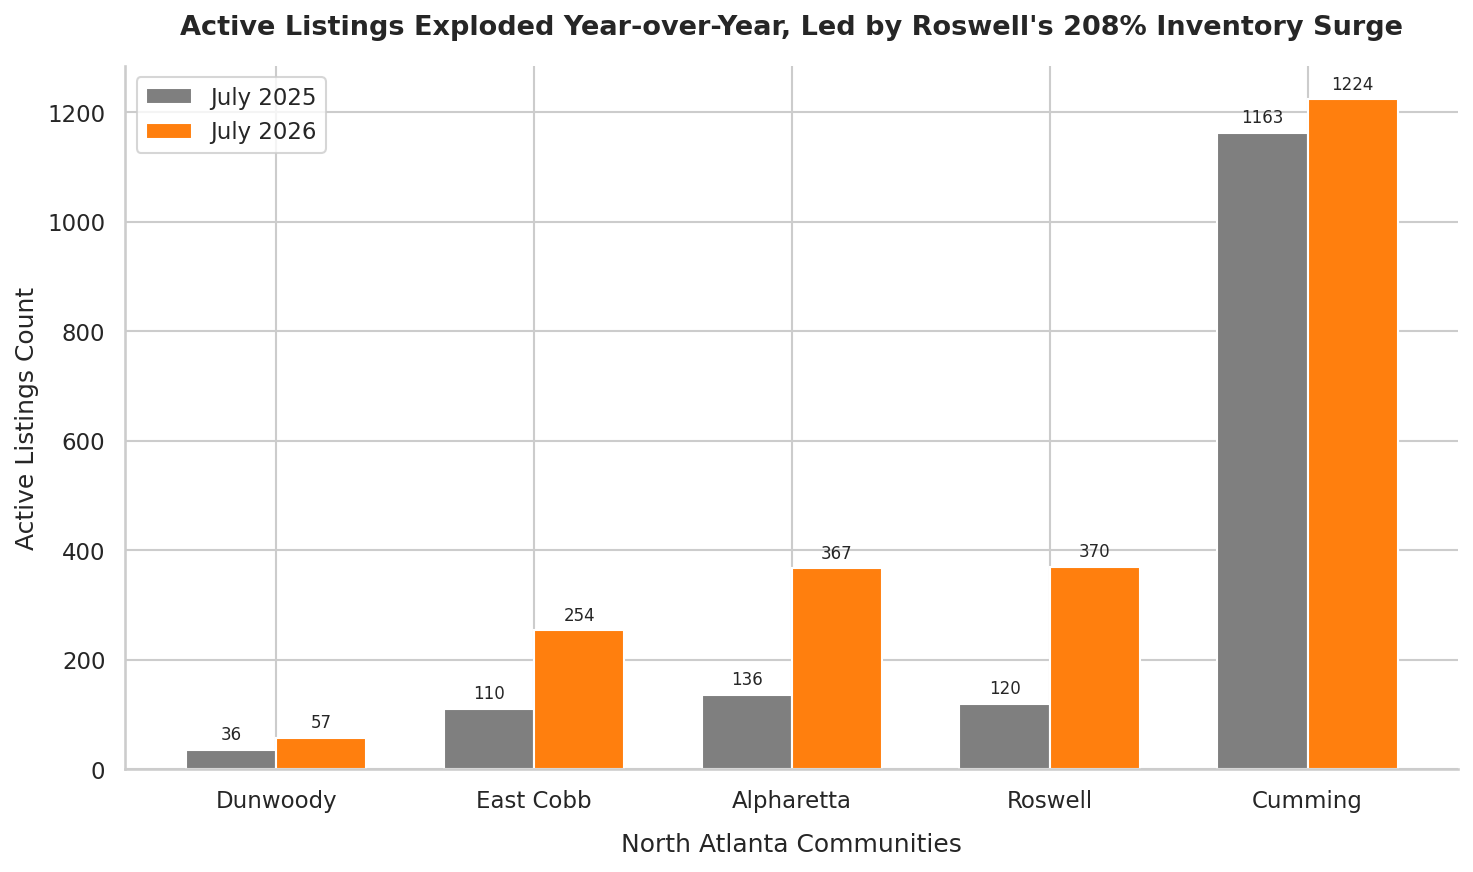
This chart visualizes the dramatic inventory accumulation across our suburbs, showing that even with minor new listing increases, active choices for buyers have doubled or tripled.
The Big Trend: The Overpricing Penalty Exposed
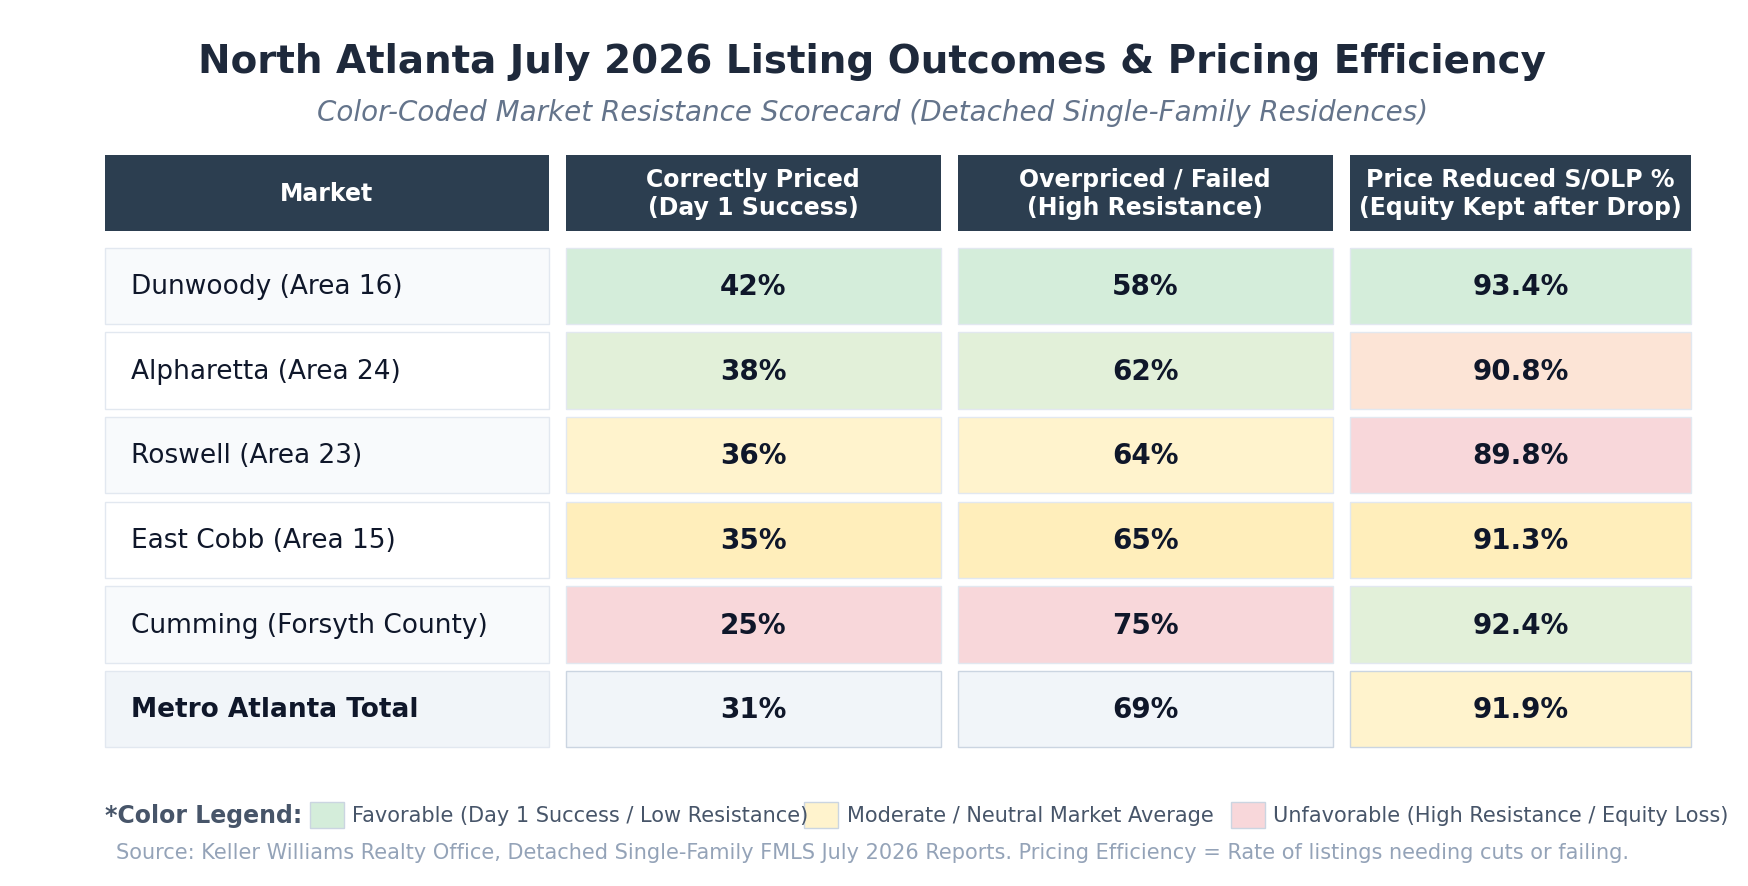
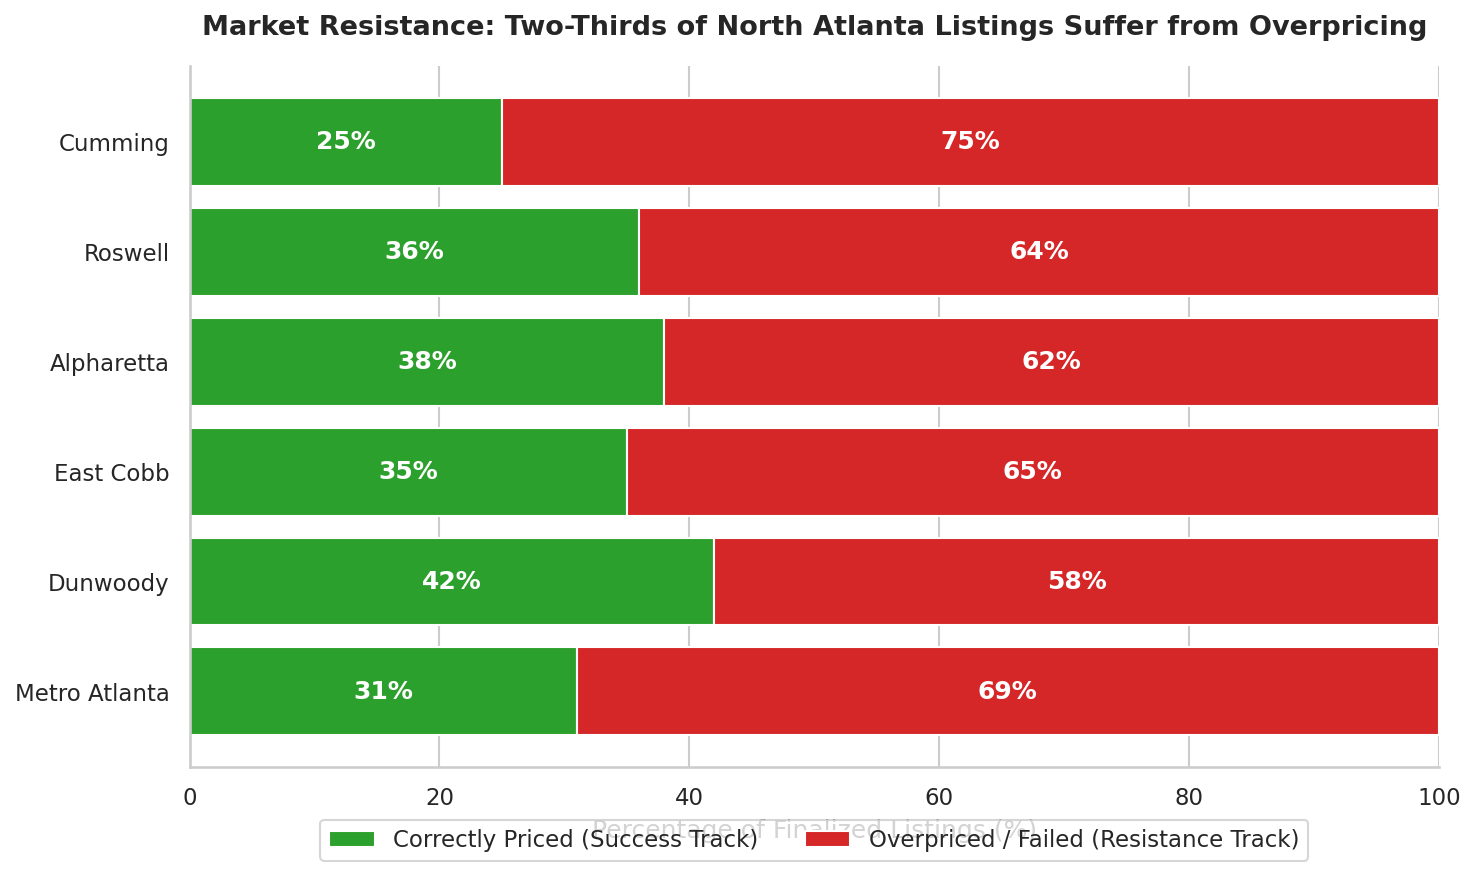
To successfully navigate this pooling inventory, every homeowner and buyer must understand "Pricing Efficiency." FMLS detached single-family home data reveals that the market is divided into two distinct listing types :
- The "Priced Right" Listings (31% of the Market): These homes align with buyer expectations from day one. They find buyers in a median of 12 days and close for 100.0% of their list price.
- The "Overpriced" Listings (69% of the Market): These homes require at least one price reduction or fail to sell entirely. If they do sell, they stay on the market for a median of 91 days, an additional 2.6 months of mortgage, tax, and maintenance costs, and eventually close for a median of only 91.9% of their original list price.
This means overpricing your home from the start doesn't just delay your plan, it costs you an average of 8.1% of your home's equity.
Pricing Efficiency Comparison: Suburbs vs. Metro
Suburban Deep-Dives: July 2026 Local Dynamics
1. Alpharetta: High Value Meets Surge in Choice
Alpharetta (Area 24) continues to attract affluent buyers, with the median sales price reaching a strong $823,500 (a 10.5% year-over-year increase). However, the days of rapid, blind bidding are gone:
- The Overpricing Toll: Homes priced correctly sell in a median of 9 days. Overpriced homes sit on the market for a median of 84 days and take a heavy hit, closing at only 90.8% of original list price.
- Carrying Cost Impact: That extra 75-day delay in selling an overpriced home represents thousands in additional carrying costs (mortgage, taxes, HOA fees) while stripping 9.2% of equity at the closing table.
2. Roswell: Crossing the Million-Dollar Median Milestone
Roswell (Area 23) homes have climbed into a new luxury tier, hitting a median sales price of $1,030,000 (up 8.4% YoY). But the massive inventory pooling is giving buyers unprecedented leverage:
- Negotiation Room: Roswell sellers are becoming highly cooperative, with 56.0% of closed listings offering seller-paid concessions with a median value of $6,750.
- Failure Warning: Roswell’s listing failure rate (expired or cancelled) holds at 37.5%, indicating that buyers are completely willing to walk away from homes priced above current comps.
3. East Cobb: A Surge in Seller Competition
East Cobb (Area 15) has seen the most dramatic shift in seller competition, with sellers heavily offering incentives to stand out in a crowded market:
- The Terminology of Concessions: Due to the inventory wave, a massive 77.6% of closed sales included seller-paid closing costs, with a median concession value of $7,505.
- Market Pushback: East Cobb listing failure rates are the highest in the area at 43.4%, indicating that almost half of all listed homes failed to sell, almost entirely due to overpricing.
4. Dunwoody: The Competitive Oasis
Dunwoody (Area 16) defies the trend of rising days on market, maintaining its status as one of the most competitive, high-velocity sub-markets in Metro Atlanta:
- Ultra-Lean Supply: Dunwoody holds just 2.0 months of supply.
- Lightning-Fast Sales: Correctly priced homes find buyers in a median of just 6 days!
- Market Efficiency Leader: Dunwoody has the lowest listing failure rate in North Atlanta at 30.0% and the highest pricing efficiency (42.0% of listings are correctly priced from the start).
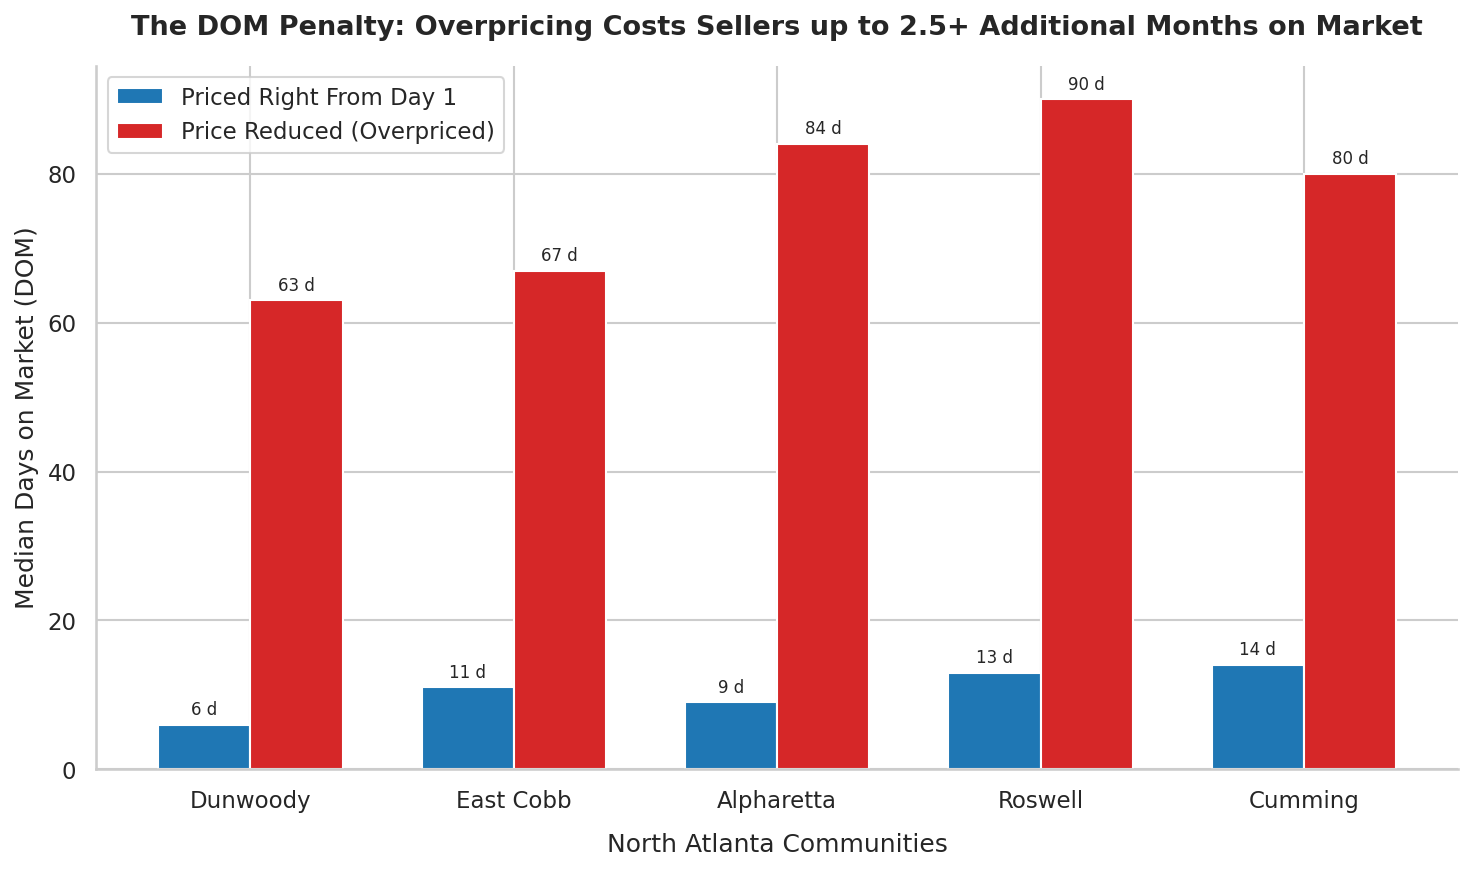
This chart illustrates the massive "Time Penalty" for overpricing. Across every market, homes that required a price cut stayed on the market up to 10x longer than those priced correctly.
5. Cumming & Forsyth County: The Balanced Frontier
Cumming (Forsyth County) represents a unique market that has maintained stable inventory conditions compared to its near-neighbors, making it highly attractive for buyers seeking choice:
- Stable Supply: Forsyth County holds 4.1 months of supply, unchanged (0.0% growth) year-over-year, which positions it closest to a balanced market in the region.
- Moderate Pace: The median Days on Market has lengthened to 41 days, allowing buyers the breathing room to do thorough property inspections and evaluations without feeling rushed.
- Negotiation Power: Roughly 52.2% of sellers had to reduce their asking price prior to receiving an offer. Correctly priced Forsyth homes sell for 99.3% of original list price, while overpriced listings sell for 92.4%, leading to a 6.9% discount ($44,500+ on Cumming's median home price).
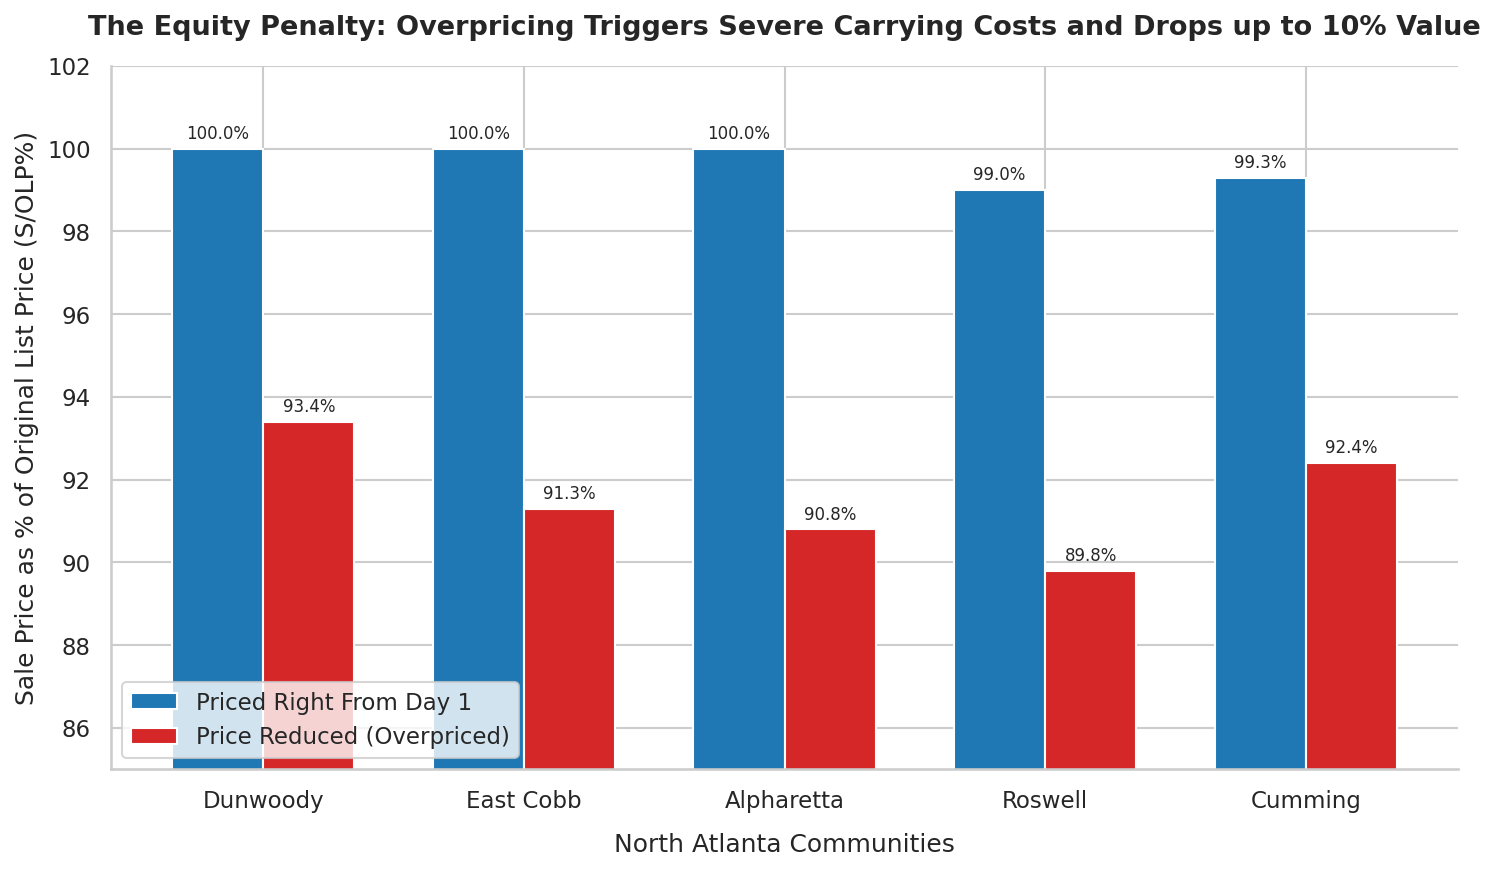
This chart demonstrates the equity impact. Sellers who miss the initial pricing window lose between 6.6% (Dunwoody) and 10.2% (Roswell) of their original asking price.
Visualizing the North Atlanta Local Pace
To help our clients understand these regional differences, we compared all five suburbs side-by-side to highlight how fast each market is moving and how much pricing flexibility exists.
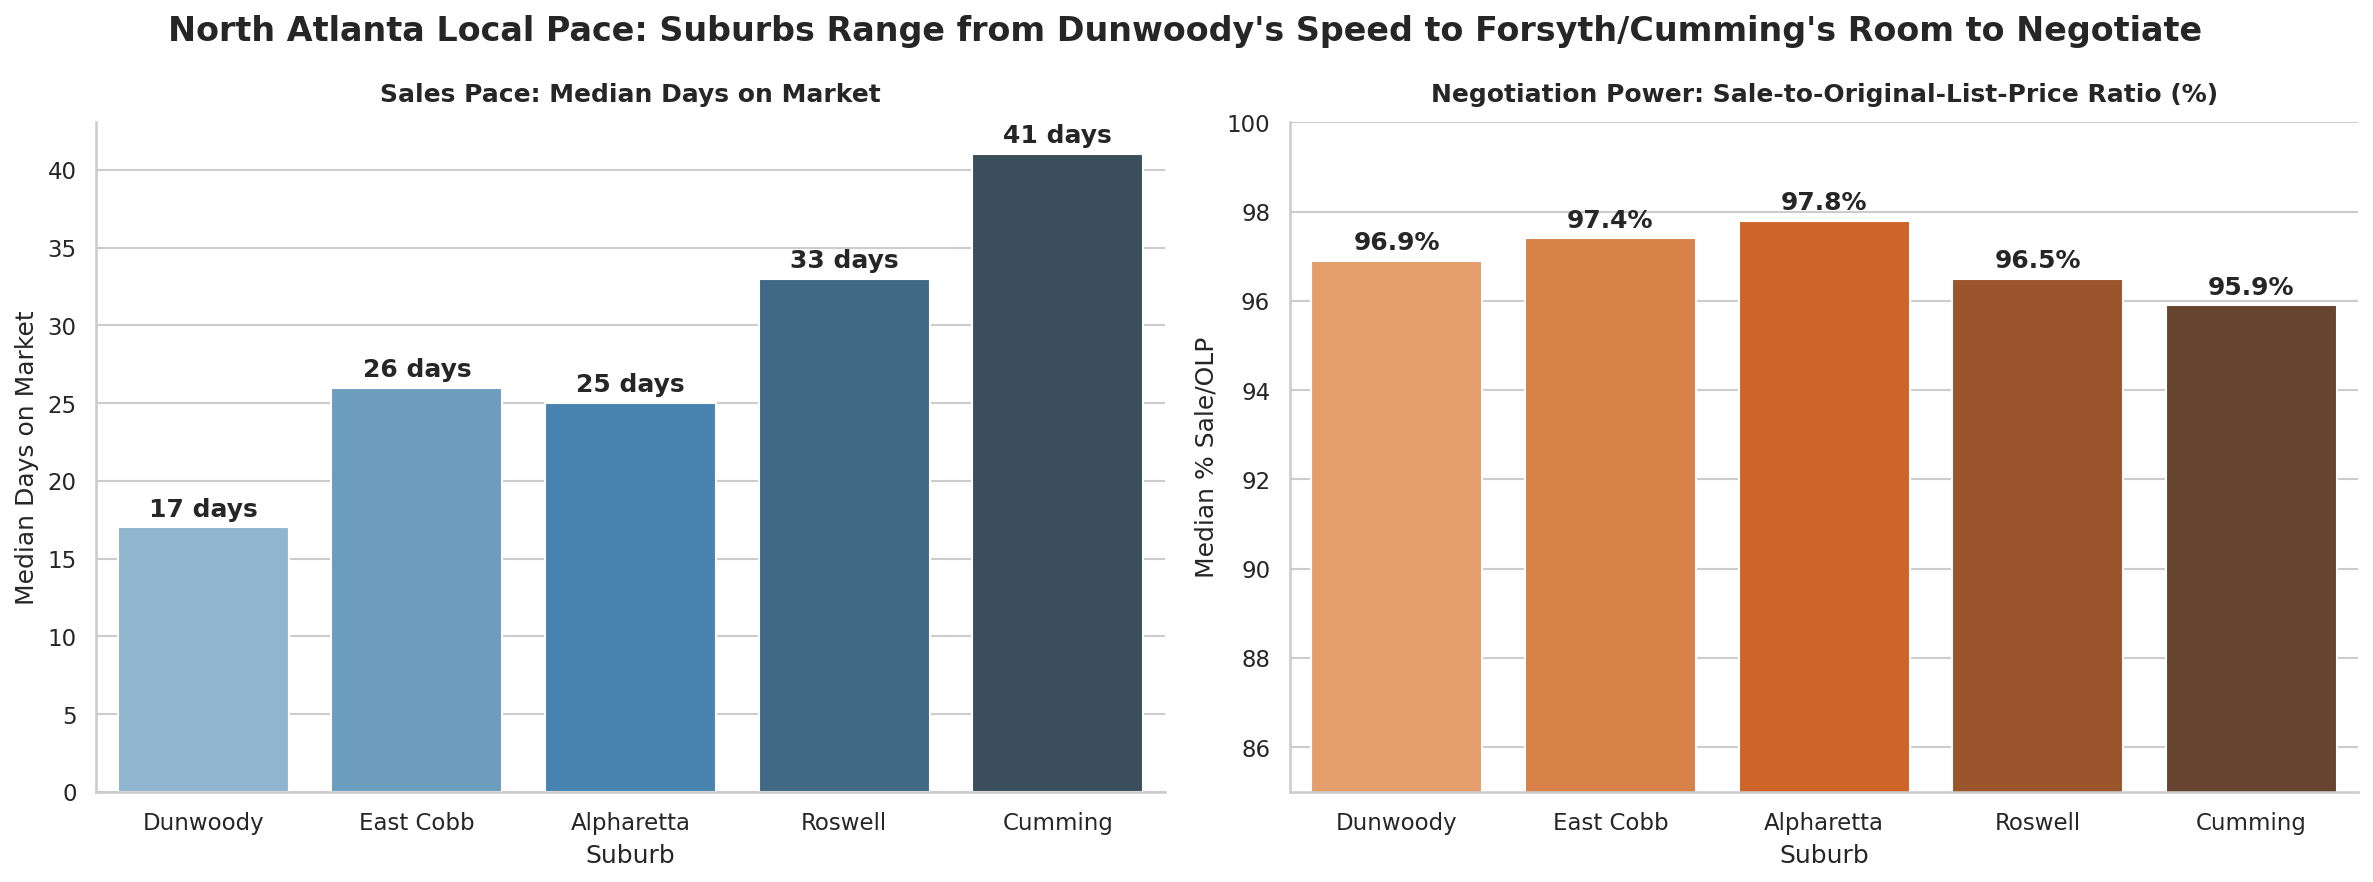
North Atlanta is not a single market. While Dunwoody offers incredible speed, Cumming and Forsyth County provide buyers with the most pricing flexibility and breathing room.
Frequently Asked Questions
What is the current average home price in Roswell GA?
As of July 2026, the median sales price for a single-family detached home in Roswell, GA, is $1,030,000, representing an 8.4% year-over-year increase over July 2025.
Why are home sales failing in East Cobb?
In July 2026, 43.4% of home listings in East Cobb failed to sell (expiring or being withdrawn/cancelled). This high failure rate is primarily driven by market resistance to overpricing, as active listings in East Cobb have surged 130.9%, giving buyers many more choices.
What is the housing market months of supply in Cumming GA?
As of July 2026, the Forsyth County detached single-family housing market (which includes Cumming) holds 4.1 months of supply. This inventory level has remained stable year-over-year and represents one of the most balanced markets in North Atlanta.
Implications for Your Real Estate Strategy
For Homeowners: Avoid the "Testing the Market" Trap
If you plan to sell your home this year, your initial listing price is your most critical financial decision. Pricing "high to see what happens" is a proven strategy for leaving equity on the table and adding months to your timeline.
- By pricing right from Day 1, you stay in the "100% Club", capturing full list price in under two weeks.
- Once you miss that window and have to reduce your price, you lose your negotiating power and typically settle for 8% to 10% less.
For Homebuyers: Use the "Linger" Strategy
The pooling of active listings in Alpharetta (+169.9%) and Roswell (+208.3%) means the tide is turning in your favor.
- You can aggressively target overpriced homes that have sat on the market for 30+ days.
- In these cases, sellers are facing the Carrying Cost Clock and are highly likely to agree to price cuts and significant seller concessions (which are currently averaging $7,505 in East Cobb and $7,500 in Dunwoody) to help you buy down your mortgage rate.
Get a Hyper-Local Market Analysis
Are you curious about the pricing efficiency of your specific neighborhood subdivision? For a hyper-local pricing evaluation, connect with Rana Tayara, your trusted North Atlanta real estate expert.
| LET'S TALK ABOUT YOUR HOME Want to know what these numbers mean for your address? Metro trends are a starting point, not an answer. If you are thinking about buying or selling in Alpharetta, Roswell, Dunwoody, East Cobb, Cumming, or anywhere across North Atlanta, I will put together a clear, honest read on your specific situation. No pressure, just real numbers and a plan. |
Phoenix Award- Atlanta Board of Realtors
Keller Williams Realty Consultants
Serving the North Atlanta Area
📱 Call/Text: 678.294.3838
✉️ Email: ranatayara@kw.com
🌐 Website: www.RanaTayara.com
Other Articles:
Homestead Exemption- Your second opportunity
Your 2026 Property Assessment is Out. What you need to know before the Deadline
How's the Real Estate Market in North Atlanta- June
Why 65% of North Atlanta Homeowners are Leaving Money on the Table
Why Atlanta is the Nb 1 City to Start a Career
Upsizing in North Atlanta
2025 Luxury Housing Market
Your 2026 Property Assessment is Out. What you need to know before the Deadline
How's the Real Estate Market in North Atlanta- June
Why 65% of North Atlanta Homeowners are Leaving Money on the Table
Why Atlanta is the Nb 1 City to Start a Career
Upsizing in North Atlanta
2025 Luxury Housing Market

Rana Tayara
| Rana Tayara Homes | Keller Williams Realty Consultants
or another way